.png)
.png)
Plot builder helps bioprocessing teams quickly see how process conditions affect outcomes without the need to wrangle spreadsheets, write scripts, or do manual calculations. With just a few clicks, you can visualize trends across runs, compare conditions, and uncover correlations that would otherwise stay buried in Excel files.
Instead of building plots one run at a time, teams can compare dozens of runs at once, spot patterns, and understand variability in minutes.
How plot builder works
- Select a full dataset or campaign and instantly compare all runs side by side - no copying, merging, or preprocessing.
- Plot how key metrics evolve over time and immediately spot deviations, trends, and variability
- Overlay set points such as pH, temperature, or feed strategy to see how different conditions shape outcomes.
- Move beyond line plots to aggregated views. Compare final values, distributions, and variability across conditions to identify what truly matters
- Mean values, standard deviations, and comparisons are calculated automatically—no formulas, no manual work.
Watch plot builder in action
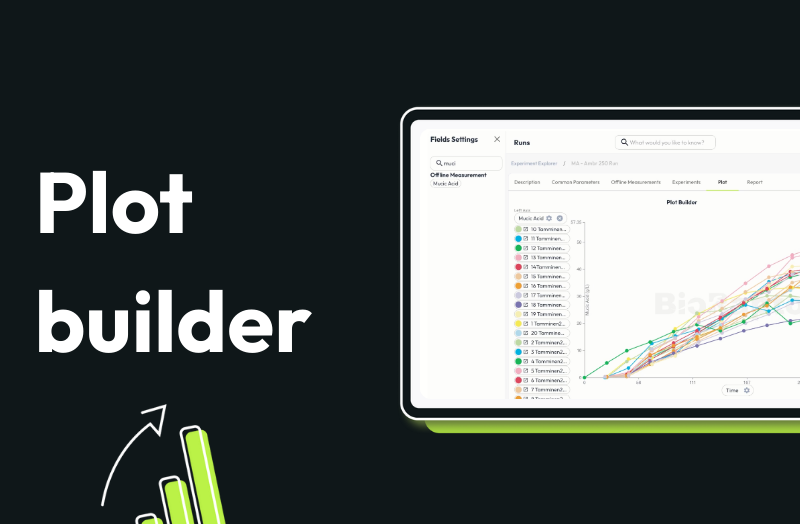
See how pH impacts mucic acid accumulation across 20 fermentation runs, and how quickly patterns emerge when your data is structured and connected.
Plot builder removes the friction between data and understanding. Instead of spending hours building plots and questioning results, teams can focus on learning faster, reducing variability, and making better process decisions with confidence.
Book a demo with us to see the plot builder in action and discover what your data has been trying to tell you.